This project used natural language processing (NLP) to analyse the London Fire Brigades corpus of free text reports. These reports are written for the most serious fire types and have been archived since the 1980s. The London Fire Brigade Business Intelligence Unit wanted to explore how to better understand and analyse these 37,000 text reports. This project shows how topic modelling can be used to understand more complex fire incidents, and explore their spatial and temporal patterns to help the London Fire Brigade in prevention of these fires. A Latent Dirichlet Allocation (LDA) was applied using term frequency–inverse document frequency (TFIDF).
There are three main reasons for the decline in the number of fires in London since the 1980s. First, technologies have improved including fire retardant materials, smoke detectors, and sprinkler systems. Second, the London Fire Brigade’s (LFBs) active education and outreach programme has been very effective at raising awareness of fire safety issues. Finally, data has been methodically collected and used by the LFB to discover patterns, which has been key to identifying fire risk, leading to informed policy and decision making.
The LFB collect a lot of data; each incident attended is recorded in a data set with 76 multiple choice fields, including information about the time, location, and ignition source of a fire. The business intelligence unit at LFB do a fantastic job of analysing these data. In addition to this large categorical dataset Fire Investigators also write free text reports for more serious incidents. Since the year 2000 the LFB have amassed an archive of over 37,000 free text reports. This data gold mine has taken hundreds of hours to write, yet historical reports have been sitting dormant because it is difficult to quickly extract information from this volume of free text.
In machine learning and natural language processing, a topic model is a type of statistical model for discovering the abstract "topics" that occur in a collection of documents. A topic is represented by a collection of words that are pertinent to that topic, for example a topic identified in fire investigation reports involved the careless disposal of cigarettes. A document/report usually concerns multiple topics in different proportions, so for example a report describing a fire in a house involving cigarettes maybe 80% related to the cigarettes topic, 15% to dwelling fires topic, and 5% for the remaining fire types. For this project I investigated multiple topic modelling approaches but found LDA to give the most intuitive results.
For a detailed explanation of LDA please see the paper in Resources or the Quora page, but for a brief summary LDA works as follows: Suppose you have a set of documents, you have chosen a fixed number of K topics to discover, and want to use LDA to learn the topic representation of each document and the words associated to each topic. One approach to do this uses collapsed Gibbs sampling as follows:
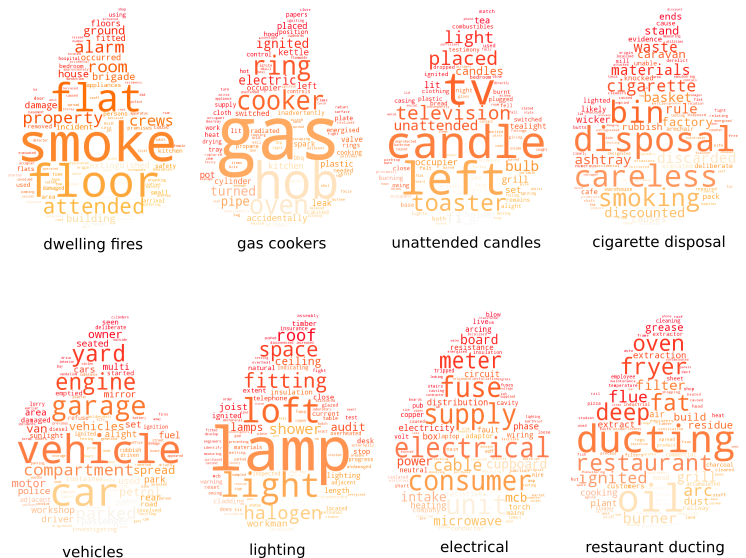
The topics extracted are fairly intuitive describing fires involving for example unattended candles, the disposal of cigarettes, or electrical faults. The most common topic found describes fires in dwellings, with words such as smoke, flat, and floor. A very interesting and potentially more complex topic that this method discovered was fires involving an accumulation of grease, fat, and oil in restaurant extraction and ducting systems. In this data we found approximately 300 of these ducting fires. The word clouds below give an indication of the relevant words in each topic, and their saliency.

Using this topic modelling approach along with the other categorical data collected by the LFB we can explore different topics in more detail. If we take the example of ducting fires. We can see in the plot below that in recent years there has been a significant increase in the number of ducting fires, despite the general decrease in fires in London.

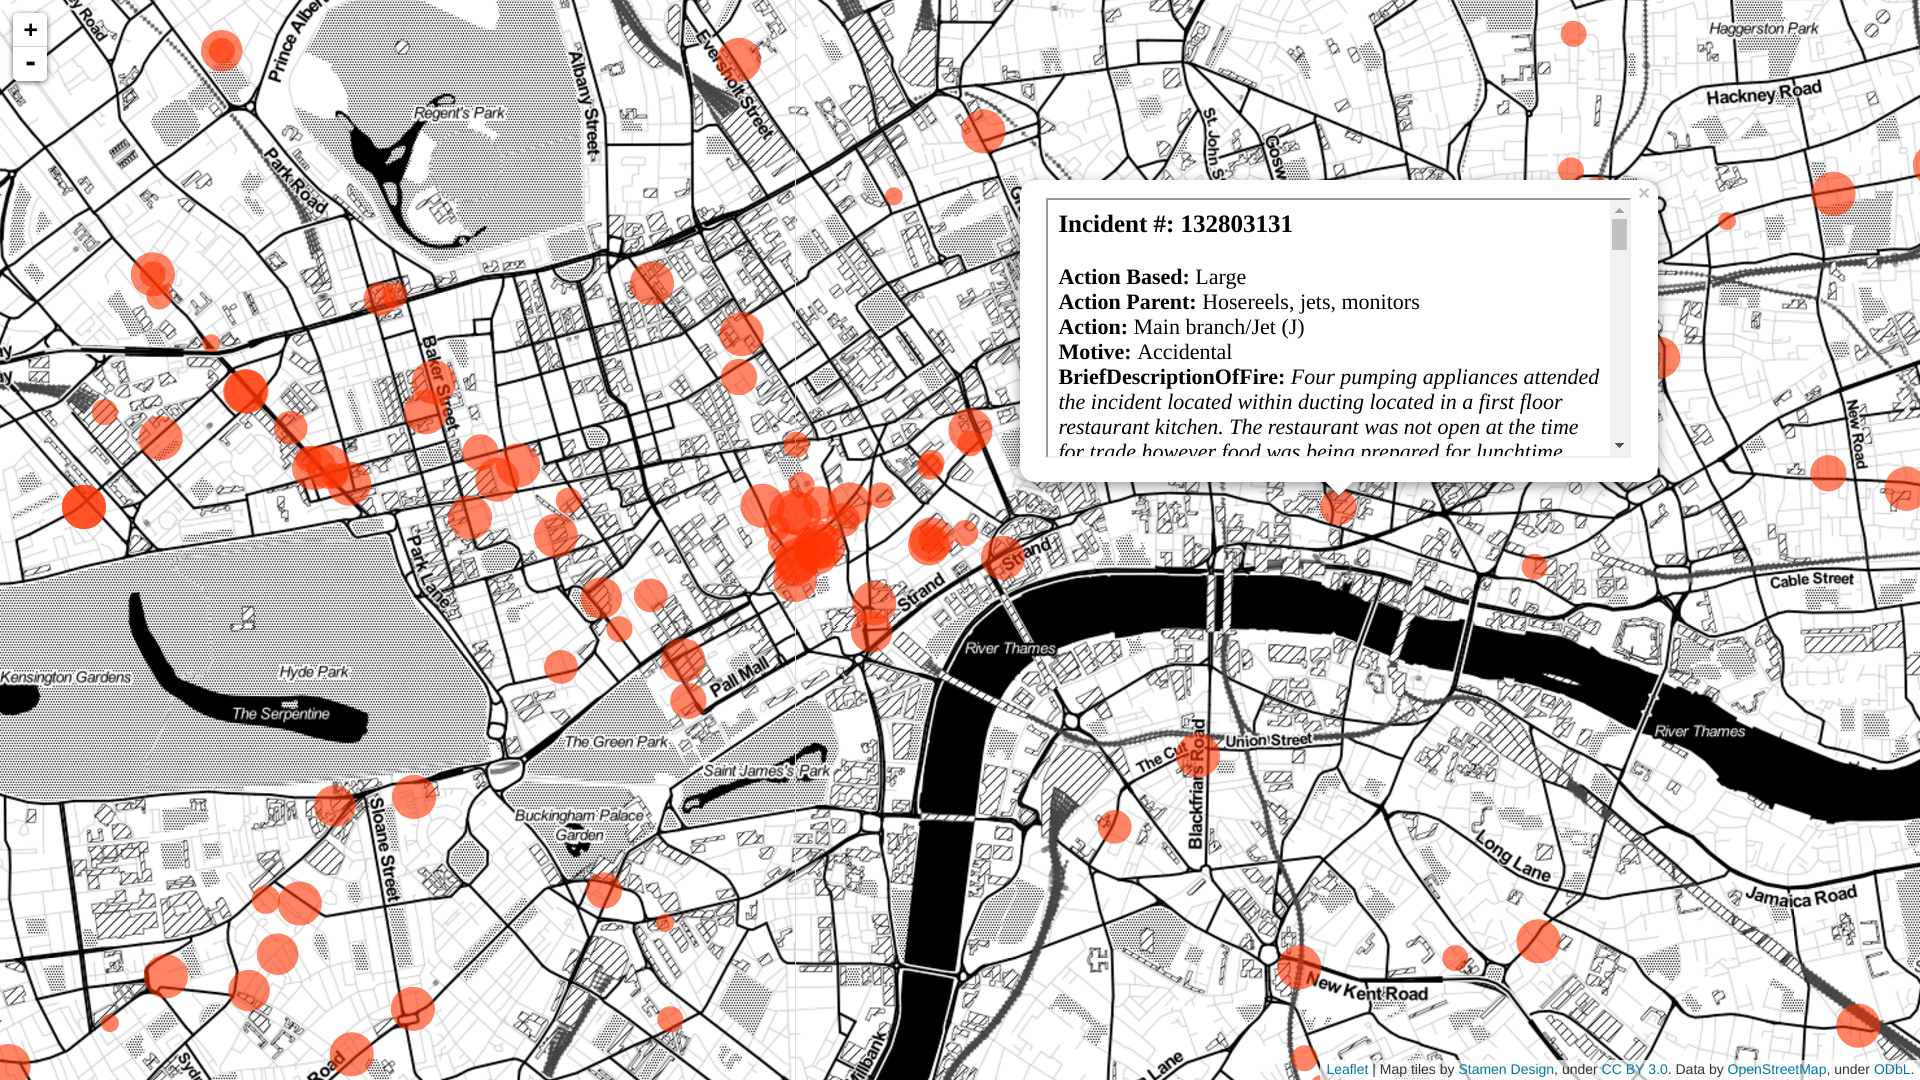
This approach also allows us to explore more subtle fire types that may not be well recorded by the structured data set. I created a tool to explore the geographic distribution of topics, again using the example of the ducting fires,. In the below image each red circle represents a ducting fire, where the circle radius indicates the fire severity, larger circles are larger fires. Individual data points can also be viewed by clicking on the circle. We can see that this ducting problem is particularly dangerous in areas like Soho and along Edgware road. This information could potentially be used to provide more targeted maintenance and fire inspection visits in these areas.

This project was conducted as part of ASI Data Science fellowship 7, further details of the eight week fellowship can be found here.
Data science fellows: William Grimes
Technical mentor: Alessandra Staglianò
Project manager: Apollo Gerolymbos